

The 2026 Sustainability Census tracks pay, teams and career movement across the global profession. Whether you're hiring or advancing, it's the benchmark data your next decision needs. Free to download

The most comprehensive study of its kind
-
![Salaries]()
Salary, Bonus & Benefits Breakdowns by Region
-
![Governance]()
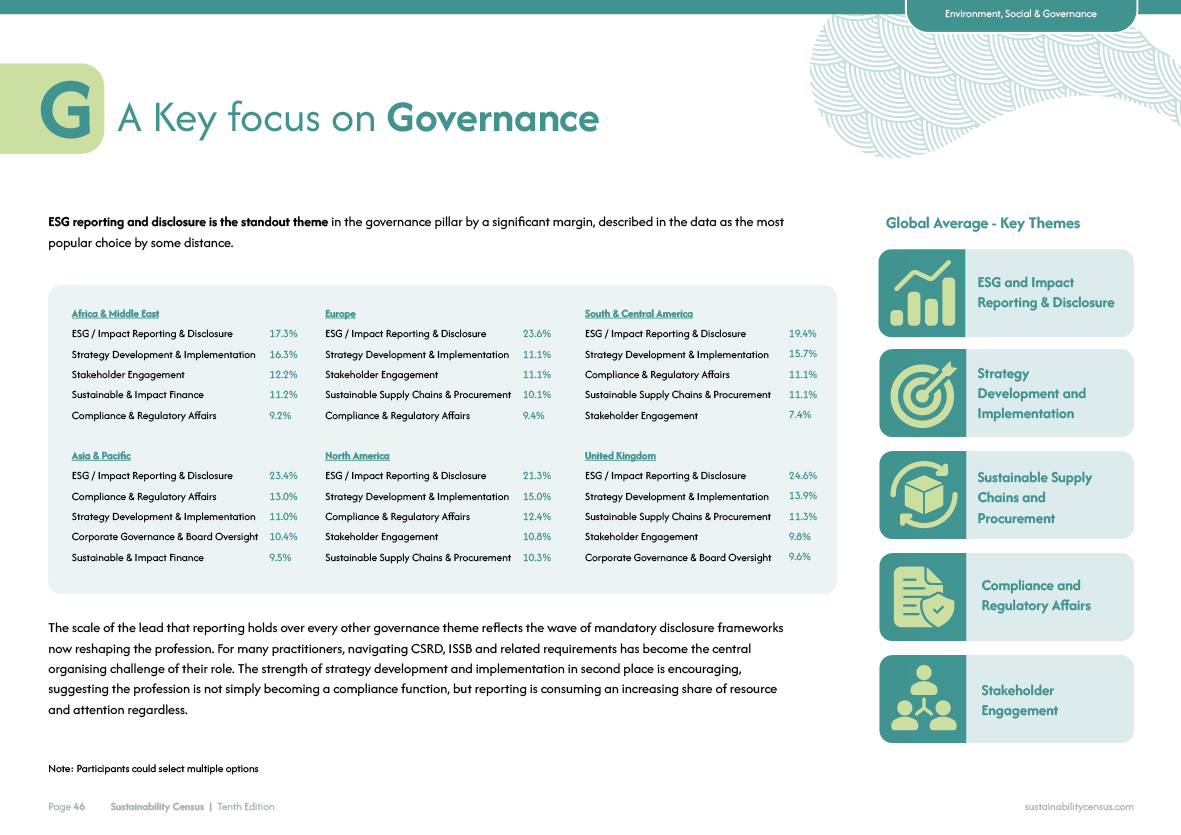
Key Trends & Priorities
-
![Insights]()
Real World Insights from Industry Experts
-
![Sectors]()
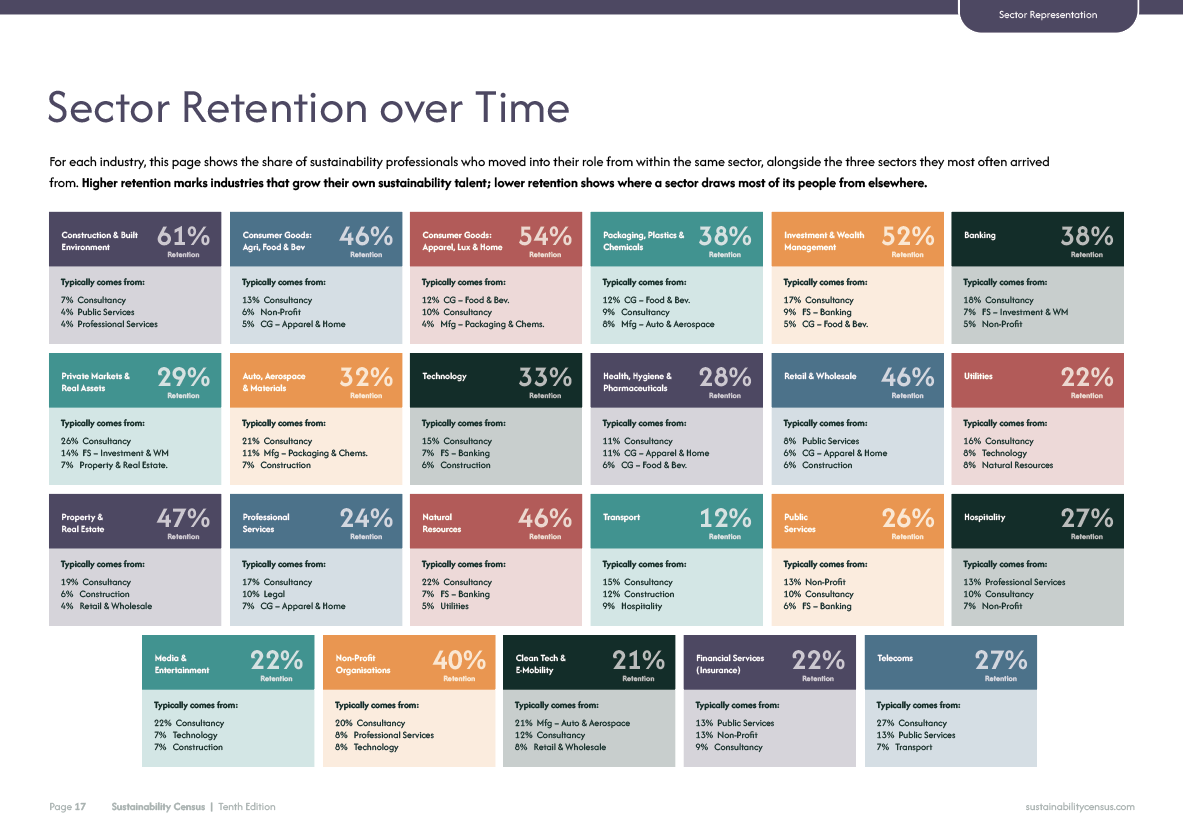
Where Does Sustainability Talent Move?
-
![Headcount Plans]()
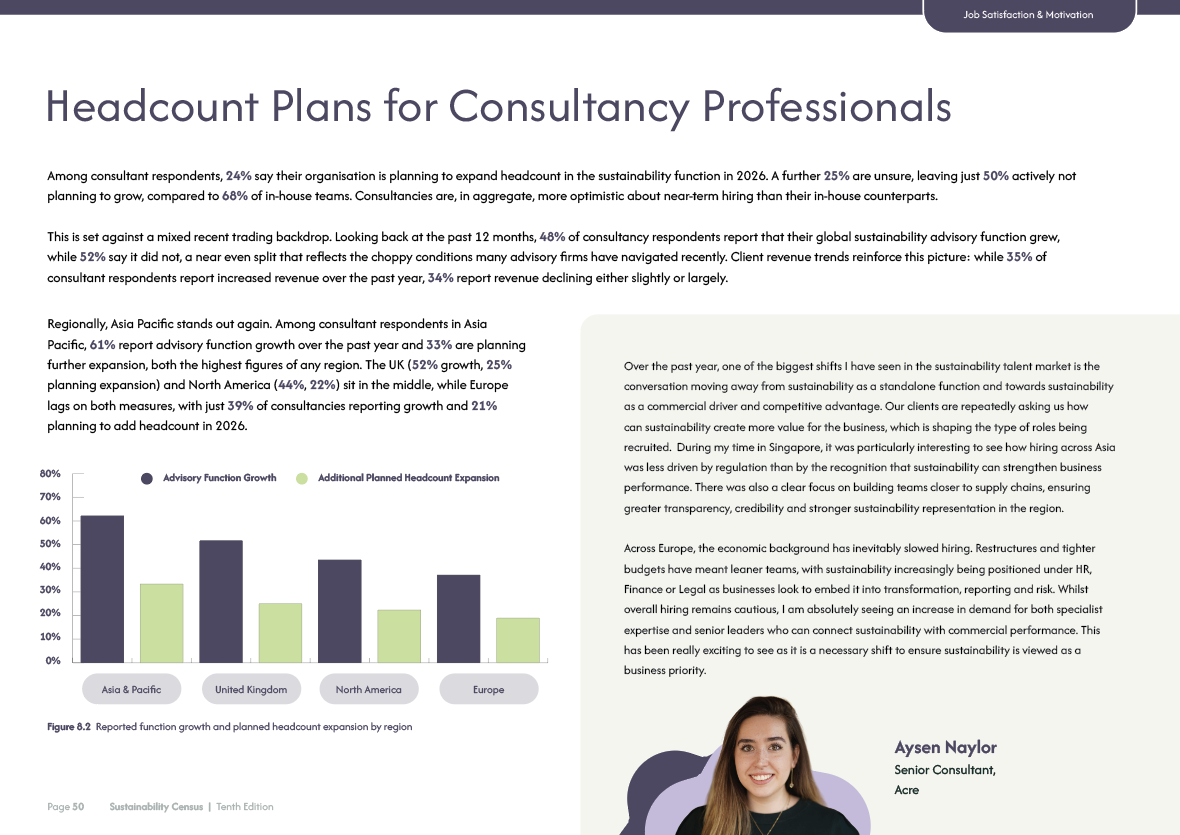
Consultancy & In-House Teams
-
![Map]()
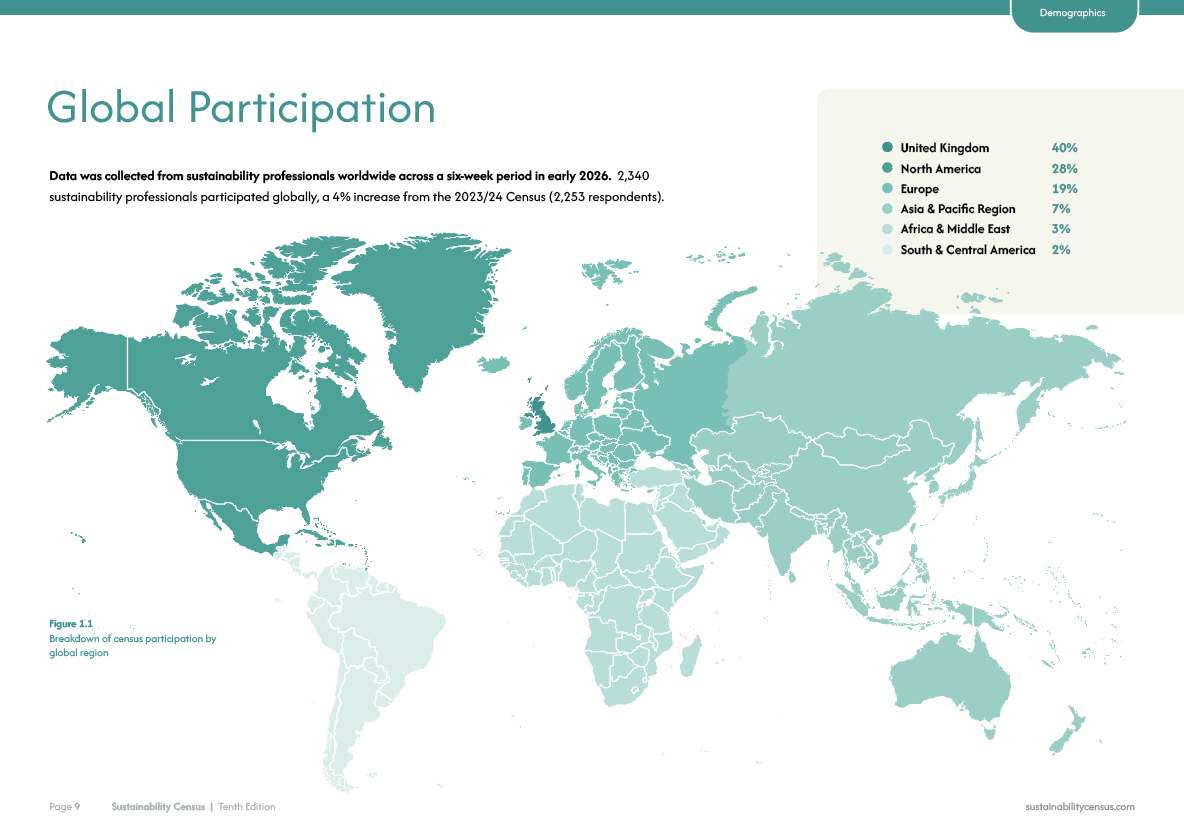
2,300+ Respondents from 76 Countries
In a year when economic and political pressures have tested sustainability agendas, our industry continues to show remarkable resilience. This free, confidential survey is designed for sustainability and impact professionals who want to strengthen their field and shape a fairer, more inclusive future.
The document gives valuable insights into pay, equity, working patterns and the varying progress of sustainability efforts across more than 70 countries,

Education and Background
Most sustainability professionals didn't start here. 58% came from another profession, with consultancy the biggest single route in. Add a workforce where 64% hold master's degrees, and the Census paints a picture of a field built on deep education and diverse backgrounds.

Salary and Remuneration
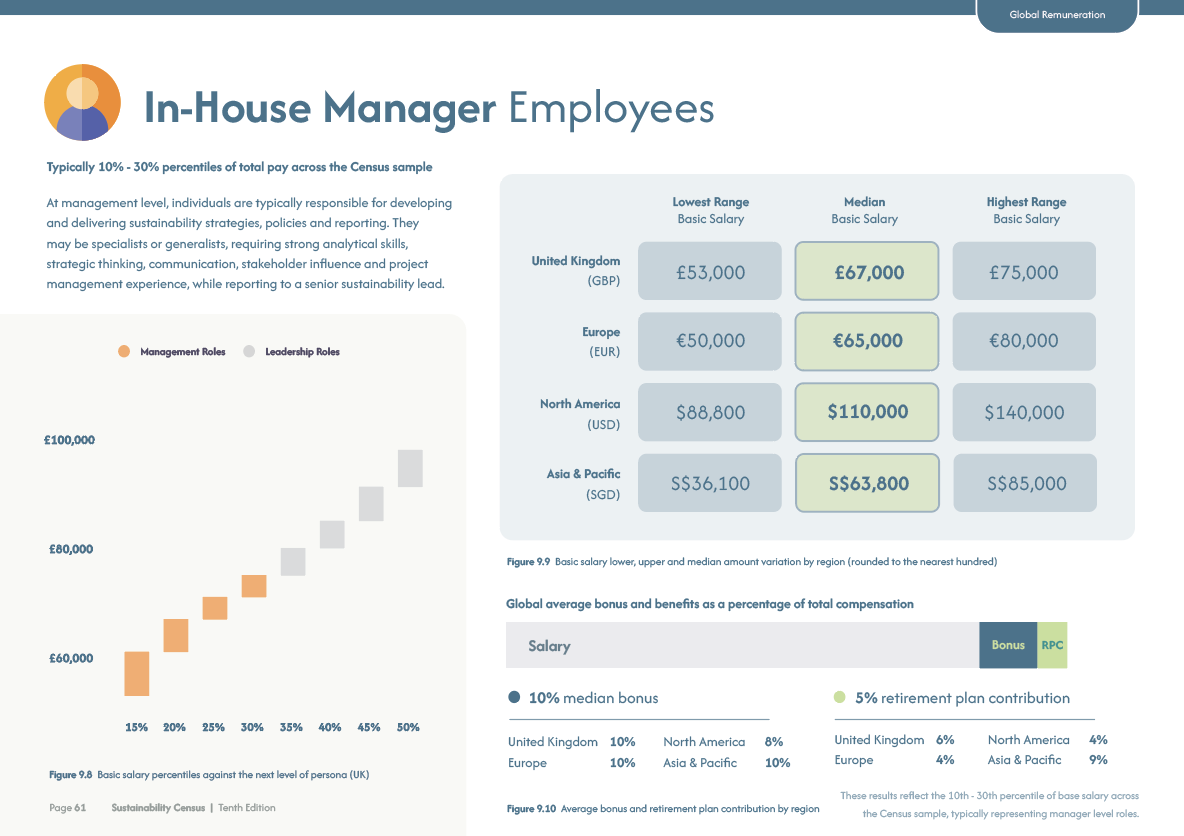
Know what you're worth. The Census benchmarks salaries by region, seniority and sector: a £95,000 median for in-house professionals in the UK, $164,000 in the US, and a persistent 20% gap between in-house and consultancy pay. The most detailed remuneration data in the profession.

Evolution of Roles and Teams
Sustainability teams are being rewired. 57% now report into another department, with Legal and Compliance rising fast. CEO ownership has fallen from 41% to 32%. The Census tracks where the function sits, who holds responsibility, and what these shifts mean for influence and resources.

Employers and
Organisations
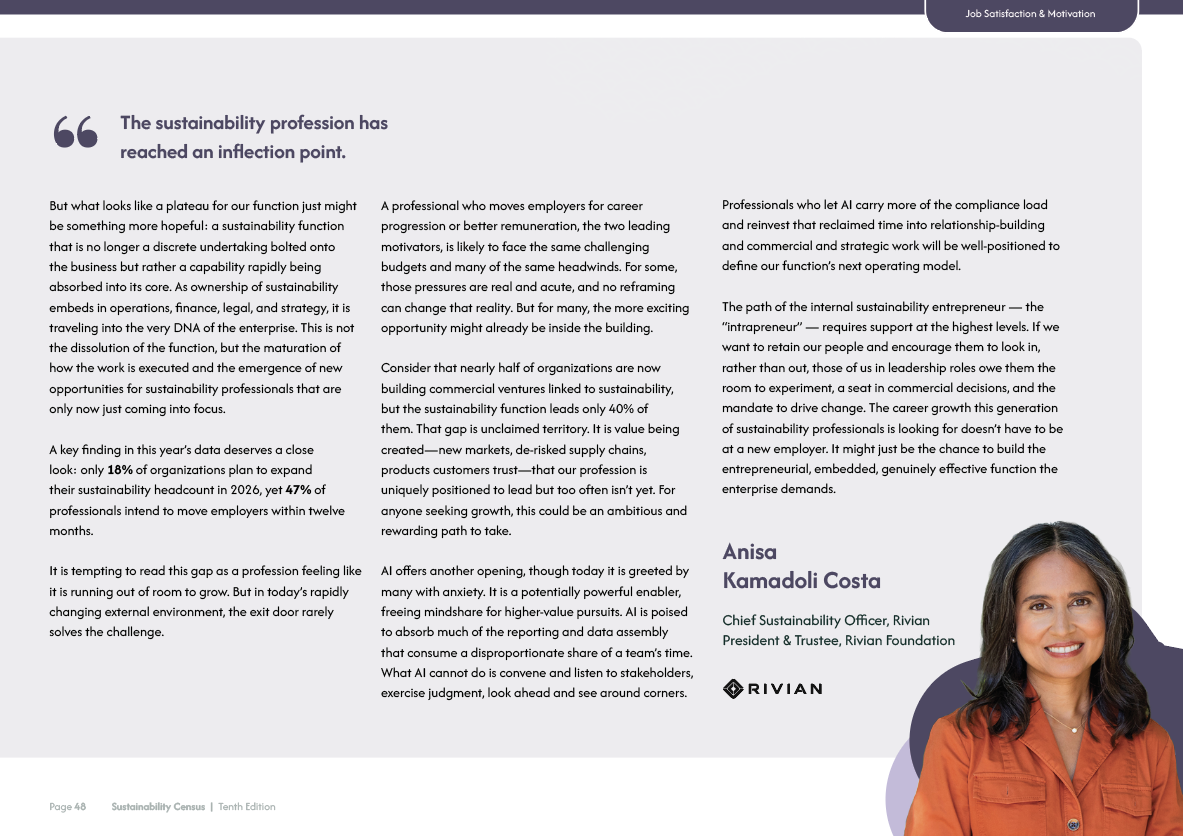
Sustainability is becoming a growth engine. 49% of organisations are building commercial ventures linked to it, yet the sustainability function leads only 40% of them. The Census tracks how businesses are moving beyond compliance, and whether the function is shaping that shift or watching it happen.

Where does talent move?
Sustainability is climbing the org chart. C-Suite titles have nearly doubled, 'Head of' roles are growing, and analyst titles are in decline. The Census maps how careers in the profession are progressing, who's moving, and what separates those who advance from those still waiting.
Previous Census Results |
Previous Census Results |
Acre, SLR
2020 CR & Sustainability Salary Survey
Acre, Carnstone, Flag
2018 CR & Sustainability Salary Survey
Acre, Flag, Carnstone
2016 CR & Sustainability Salary Survey
Acre, Flag, Carnrstone
2014 CR & Sustainability Salary Survey
Acre, Flag, Carnstone
2012 CR & Sustainability Salary Survey
Acre, Carnstone, Ethical Performance, Flag
2010 CSR Salary Survey
Acre, Carnstone, Ethical Performance
2008 CSR Salary Survey
Acre, Carnstone, Ethical Performance
2007 CSR Salary Survey
Acre, Carnstone, Ethical Performance
Gain insights that fuel your 2026/27 strategy
Whether you're building a team or building a career, the Census gives you the evidence base for the year ahead. This year we've gone deeper on pay than ever before. Salary bands now map to six personas, from Junior through to Executive, built on percentiles of the pay distribution rather than job titles, so a benchmark in London means the same thing in New York or Singapore.
We report in-house and consultancy separately at every stage, because the two markets behave differently: in-house professionals in the UK earn a median of £95,000 against £76,000 in consultancy, a gap that holds across seniority levels.
Beyond pay, you can test your reporting lines, bonus structures and board representation against your peers, and see where the talent market is heading before you hire, with 47% of professionals planning a move and only 18% of organisations expanding. Download it free and plan 2026/27 with confidence
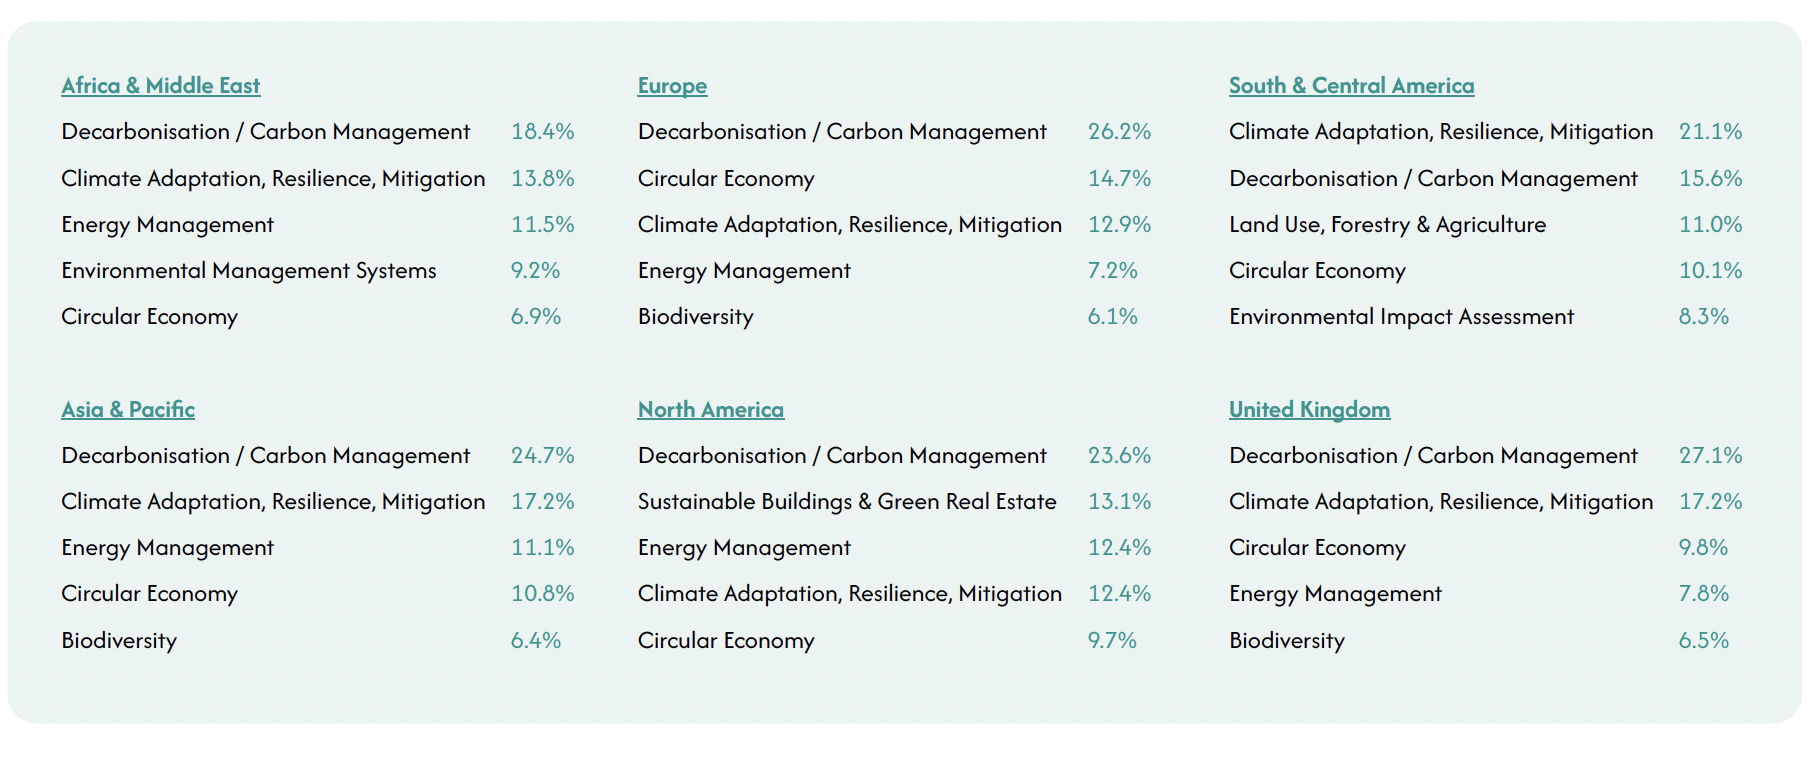
2026/27: Key Environment Themes broken down by Region
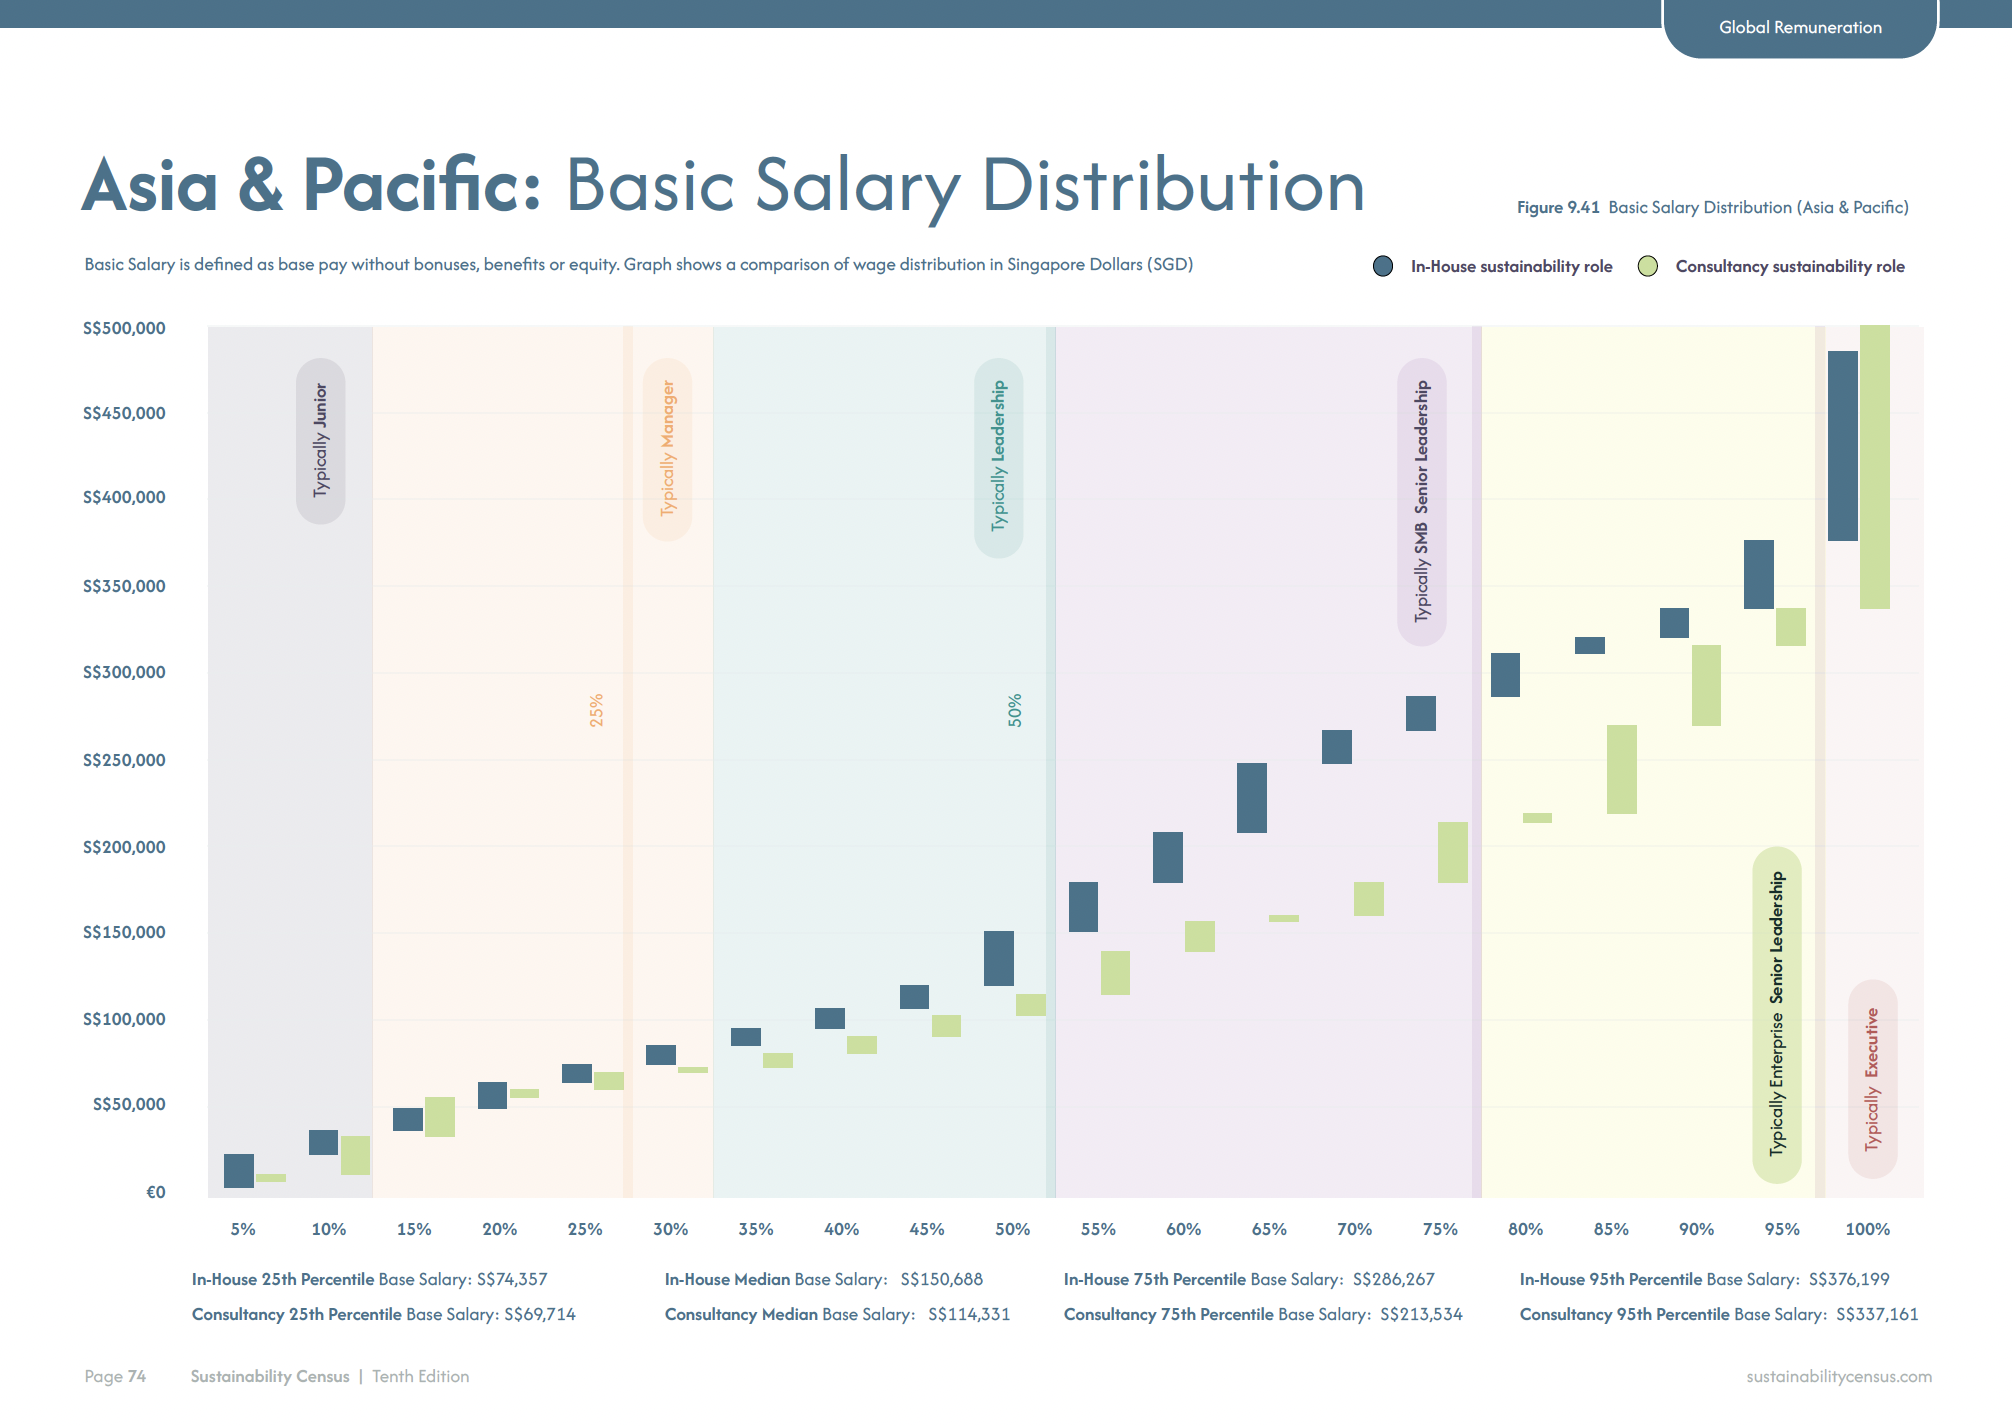
2026/27: 12 Distinct Salary Bands (Junior - Executive) Split into Regions
FAQs
How do I view the 2026 Census?
It’s simple. Click the button at the top of this page to download the Census. We’ll ask for a couple of details and you’ll be sent directly to view the Census as a PDF file. If you’d like to save the file to read at a later date, you’re able to do so by using the ‘download’ button in your browsers PDF window.
Did only people who work within a sustainability role take part in the Census?
We didn’t require ‘sustainability’ in participant’s job title, but their role involved sustainability in some way - whether that’s ESG reporting, climate strategy, responsible sourcing, or anything else that touches on environmental or social impact. If your work contributes to sustainability goals, your voice mattered in this survey.
How anonymous is this survey?
Your privacy is our priority. All responses have been fully anonymised and treated with strict confidentiality. No individual answers will ever be published or linked back to you. We only share aggregated insights, so you can take part knowing that your information is secure and your identity will not be revealed in any way.
What benefit does this survey have on the wider sustainability professional community?
The Census provides a comprehensive snapshot of the sustainability profession - covering salaries, team structures, job satisfaction, EDI, and more. These insights support strategic decisions around team building, investment, and policy. They also help organisations benchmark themselves and give professionals the data they need to advocate for change and resources.
What does it cost to view the results?
Nothing. The Sustainability Census is entirely free to access. We don’t believe in paywalls for something that benefits the wider sustainability profession. Our goal is to make these insights accessible and impactful, helping individuals, teams, and businesses make informed, strategic decisions based on real-world data.
How do I view an archive of the previous census results from 2007 to 2024?
You can access all previous Sustainability Census reports directly from the homepage of the Sustainability Census website. That includes the latest 2024 edition, which saw a record number of responses and a broader focus beyond salary. It covered everything from team resources to EDI and job satisfaction. We’ll also aim to show trends over time in this year’s edition using data from previous census results.